中文版:2023/1/21博客受攻击宕机事件分析与复盘 – Frank’s Weblog
On 1/21/2023, my blog was attacked and went down for 4 hours. This article will cover what the incident was like, the root cause analysis and improvements.

On that day, I woke up in the noon and saw the alert email from UptimeRobot. Sometimes a network or server glitch can trigger an alert as well, but it have been 2 hours since alert triggered, so apparently that’s not the case. I found I was not able to connect to the website, while sometimes I could connect but got 504.
I ssh-ed to the server and restarted all the Docker containers, but the problem persists. top showed that all the load average were 6.xx and most of the CPU usage were from php-fpm. I checked the graphs in nginx amplify and found that nginx have received large amount of requests during past few hours.
I planned to go grocery shopping for the lunar new year dinner with my girlfriend, so I didn’t want to spend too much time on this. I simply turned on the Cloudflare reverse proxy(orange cloud icon) and “Under attack” mode and left home.
After a while I received the alert clear email from UptimeRobot and website was back online.
Over last few years I’ve implemented a set of monitoring and security measures for my site and automated scripts to mitigate common issues.
- UptimeRobot for monitoring downtime. I’ll receive alerts if the website cannot be reached or returned HTTP status that indicates a malfunctioning(5xx).
- nginx amplify for monitoring nginx and OS metrics. I’ll receive alerts if some metrics(eg. disk usage, requests per second) goes over the threshold.
- If requests per second goes over the threshold, it will automatically turn on Cloudflare proxy and increase security level.
- WordPress security plugin automatically blocks malicious requests.
Benefit from these measures, my site have maintained a uptime of nearly 100%. Being a blog that only have 2 digits of visitors everyday, 4 hour downtime is nothing to worry about. But my professtional habit have been wondering what happened behind the incident, especially why these measures failed to prevent the incident from happening.
Analysis
Unless specified, all times mentioned below are Eastern Standard Time(UTC-5)
I exported nginx access log and did a simple visualization with goaccess. (Times are UTC)
We can see that server received a large amount of POST /xmlrpc.php , all the requests body are a few hundred bytes, this is a piece of log that logged a malicious request:
172.28.0.1 - - [21/Jan/2023:11:56:36 +0000] "POST /xmlrpc.php HTTP/2.0" 200 212 "https://nyan.im" "Mozilla/4.0 (compatible; MSIE 7.0; Windows NT 6.1; Trident/6.0)" "-"Security plugins usually blocks these malicious requests automatically. However, the log shows that these requests are all from 172.28.0.1 — This is a internal IP address from Docker network, security plugins usually ignores these internal of IPs.
I visualized the log with a Python script and created a graph that describes the time distribution of the attack. We can see that the rate is about 80 requests per minute. However, to trigger the script that automatically enables Cloudflare and raise the protection level, it needs 50 requests per second.
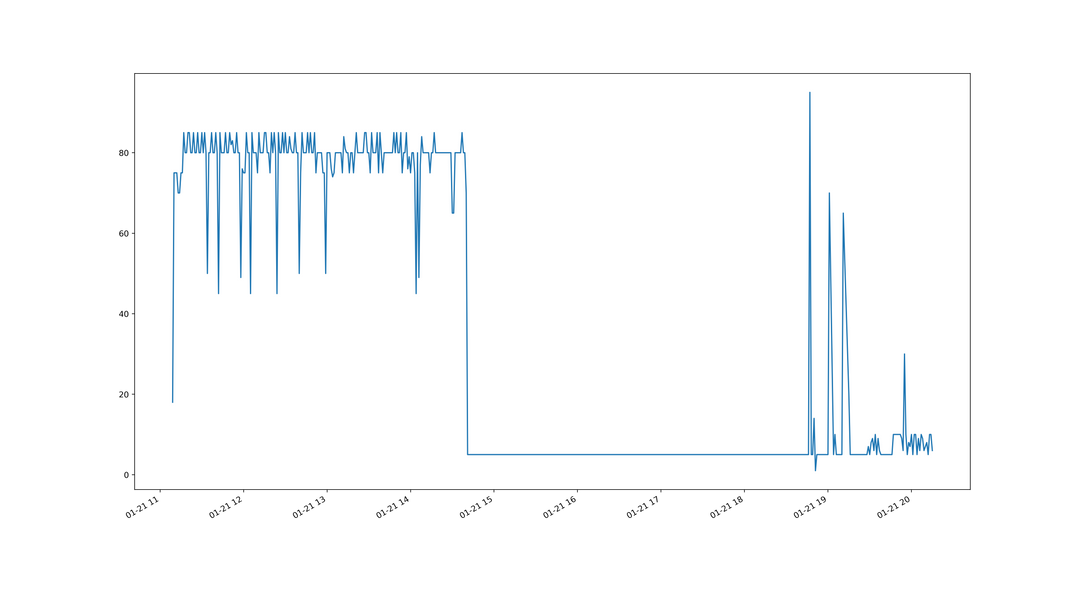
According to the graph above, 80 requests per minute is less than 2 requests per second. It doesn’t look like a very large number that blows up the entire server.
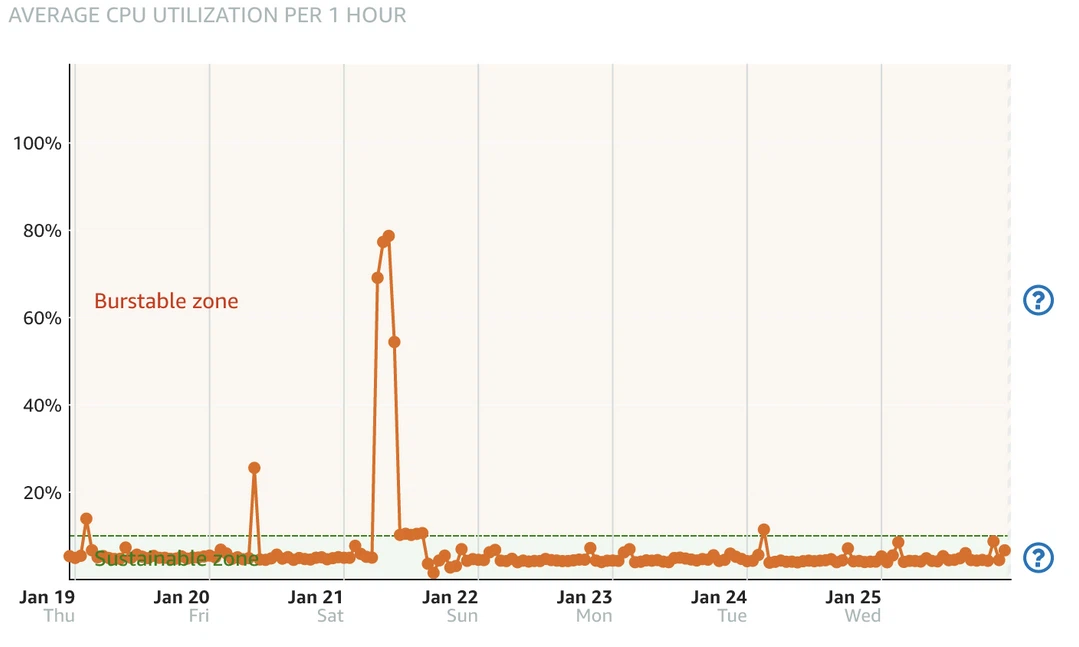
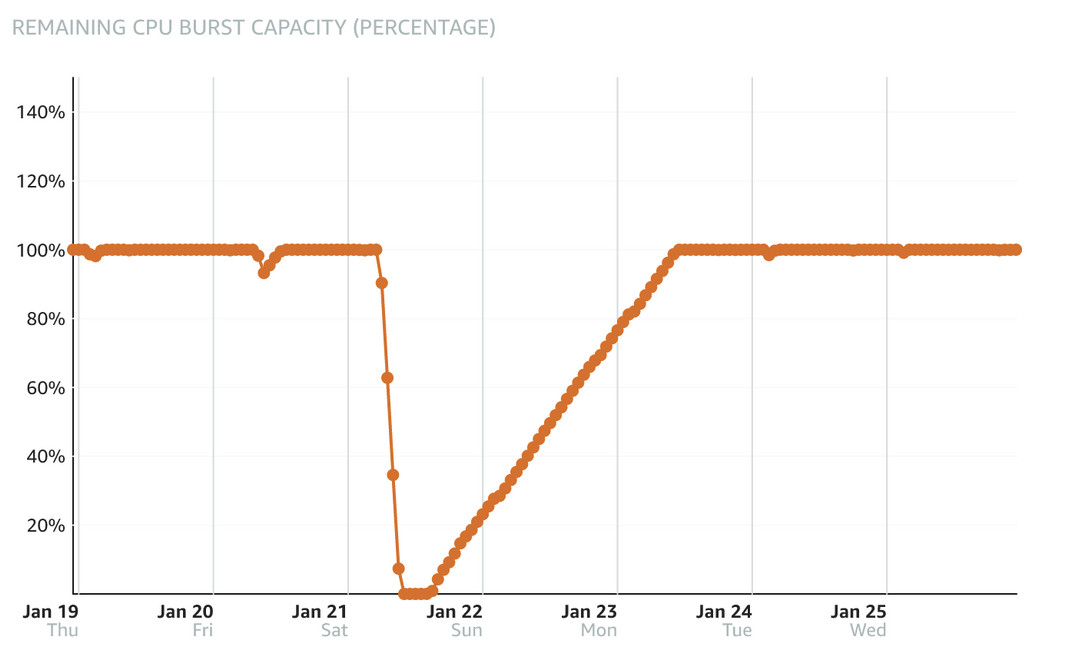
I checked AWS Lightsail metrics and found out that the computing usage is divided into sustainable zone and burstable zone, by the baseline. The baseline varies in different instance types, typically, the larger the instance, the higher the baseline. For my 1C1G instance, the baseline is 10%.
When CPU usage is higher than the baseline, it enters burstable zone and meanwhile burn burst capacity. Once the capacity reach 0, it’s no longer able to “burst”, the computing performance will be restricted below 10%. This explains why the attack started at 6, but the server didn’t went down until 10.
There’s still one question remains unanswered: I configured static disk cache with W3 Total Cache, the pages with cache will be directly served by nginx without going through php. Nginx is good at serving static files, even if the computing performance is limited, it shouldn’t have stopped working completely.
I checked the nginx config generated by W3 Total Cache, and I found out that nginx was not configured to serve cache from disk directly, that means all requests still had to be processed by php.
After checking W3 Total Cache config, the Page Cache was configured to use “Disk Basic”, but Disk Basic doesn’t let nginx to serve static cache directly without going through php[1]. The right config should be “Disk Enhanced”.
I realized a few months ago, when I was using W3 Total Cache to configure HTTP/2 PUSH, because HTTP/2 PUSH only supports “Disk Basic” mode, so I changed it to Disk Basic without fully understand the difference between Disk Basic and Disk Enhanced.
Timeline
Based on the analysis above, here is the timeline of the incident:
- 6:00 Attack started, Lightsail Console recorded the CPU usage increased to 60%, and burst capacity decreased to 90%.
- 6:09 Large wave of attack started.
- Sometime between 9:00 and 10:00: Burst capacity ran out, CPU was limited to 10%.
- 9:42: The requests amount recorded by nginx log decreased sharply, and the HTTP status of the remaining requests changed from 200 to 504 and 499. This should be the time that the server stopped serving webpage.
- 10:10 Received alert from UptimeRobot.
- 13:30 I did simple mitigation after seeing the email by turning on Cloudflare and its Under attack mode.
- 14:00 CPU usage decreased to below 10%, burst capacity started to recover.
- 14:49 Received alert cleared email from UptimeRobot, total downtime was 4 hours and 38 minutes.
- 15:15 Attack stopped.
Conclusion
Disasters don’t just happen. They’re a chain of critical events.
—— Seconds from Disaster, National Geographic Channel
This quote was from the “Seconds to Disasters”, my favorite TV program when I was young. Behind every incident there are actually many steps that could have prevented the incident or mitigated the damage, but for some reason each of them did not work as expected. So what is the “chain of critical events” in this case?
- The site was attacked, the attacker flooded the site with
POST /xmlrpc.phprequests - Cloudflare was not enabled by default, and all requests directly hit the server.
- Automated mitigation was not triggered because the threshold was set too high
- Docker failed to pass the correct IP caused security plugin failed to work.
- Processing these requests consumed a lot of computing resources and burst capacity was exhausted, resulting in CPU being limited to 10%.
- Due to a mistake in configuration, the requests were not served directly by the static cache, but still needed to be processed by php, resulting in completely stopped displaying pages with limited computing performance.
Improvements
Disable xmlrpc
Only two main features: Jetpack and Pingback relies on xmlrpc in WordPress. I chose to disable xmlrpc from the nginx level and only open it to Jetpack’s IP address[3].
Always use Cloudflare
The main reason I did not turn on Cloudflare reverse proxy before was that Cloudflare will slow down visitors from China. After testing, compared to the connecting directly, the TTFB from China increased from 500ms to 900ms after using Cloudflare. It is indeed a major slowdown, but still acceptable. I’m considering switching to Cloudflare Tunnel later.
Adjust threshold for triggering alert and automatic mitigation
Lower the threshold for automatically raising Cloudflare’s protection level from 50 requests per second to 10 requests per second.
Passing correct IP
After enabling Cloudflare, most WordPress plugins can automatically read the real IP address from Cloudflare’s header, without special configuration.
Configure static cache correctly
Change the Page Cache method to Disk Enhanced.
References
[1] Difference between w3total cache disk enhanced and disk basic – WordPress Development Stack Exchange

发表回复/Leave a Reply